
Summary: Three important things to consider. Historically markets tend to revert back to the mean. Historically, most investment managers cannot beat overall market performance. Oftentimes, you can control, even reduce, costs associated with your securities portfolio. Consider all three when building out your community financial institution plan for 2022 and longer-term strategy.
An Important Companion Event: Attend this complementary Quarterly Fed & Market Call to round out this article. Speaker Dr. Ed Seifried. Tuesday, February 1st. Find out more here & RSVP.
Where are markets headed? Rates? A recent WSJ article that some 85% of active U.S. stock funds were on pace to underperform their broader market. Similarly, there are great firms out there forecasting, for a myriad of reasons, that over the next 12-24 months rates will increase, remain steady, and yes, even decrease. It all points to an interesting realization, the broader markets, or collective wisdom, may be a place to take your cues from, rather than the potential fickleness of any single individual or single firm.
Where we sit today, the “markets” have priced in 4 rates hikes between today and into 2023. The “markets” show that bonds remain overvalued and were until very recently priced at a premium. The collective top-performing Community Banks and Financial Institutions have figured out the best mix to beat their peers. Of course, things will change, but the “market” might be the “North-Star” that one should consider comparing individual advice sources to and build strategies to mirror collective wisdom from.
Pendulums move and our “known unknown” market factors include:
We believe that, in the end, things revert back to some semblance of “the mean,” and that the ‘markets’ continue to remain out of whack for many understandable reasons such as governmental stimulus, Covid dislocations, human nature.
Remember that some 85 out of 100 investment advisors could not beat the simple ‘market’ performance, and that great investment firms that support and advise community financial institutions have opposing views on if rates are going up, will be steady, or will decrease over the next 12 to 24 months. That should not build confidence.
Consider where the historical mean lies, and then bench-test the assumptions being used that drive your guidance that mean-reversion might not happen. Following what the broader successful ‘market’ is doing may be better advice than the advice of one or two firms – even if great firms.
Look to understand the full costs of underperformance and explore methodologies that drive top securities portfolio performance to mitigate more-difficult-to-control risks and do this at lowest possible cost which you can control.
Exploration: Let’s look at the first “known unknown” as an example – the potential for equity market correction & effect on consumer confidence and consider what a rising rate environment might trigger.
Three out of five equity market values point to overvalued equity markets. Historically there has been degrees of an inverse relationship between equity and bond markets and the equity markets performance effects consumer confidence which effects the broader economy and business sentiment.
Even with January’s recent correction factored in, the S&P 500 PE Ratio is still some 60% higher, and around two standard deviations more than the modern-era historical mean, placing it in and around ‘strongly overvalued’ territory using this model.
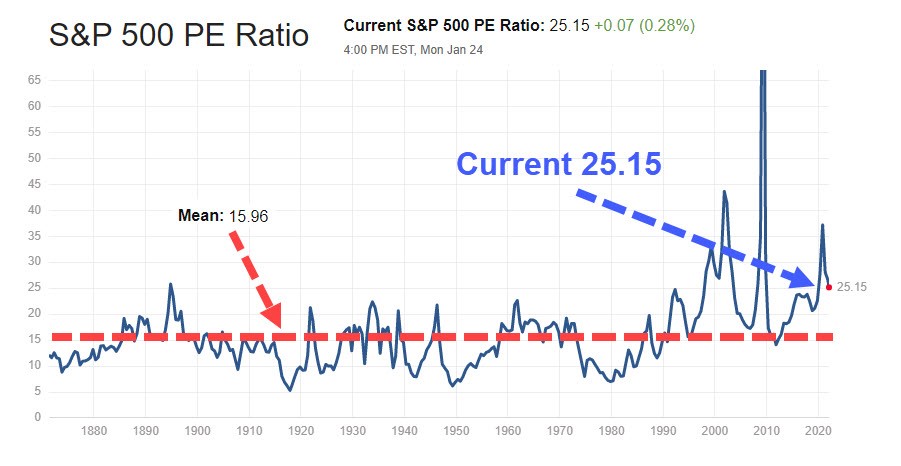
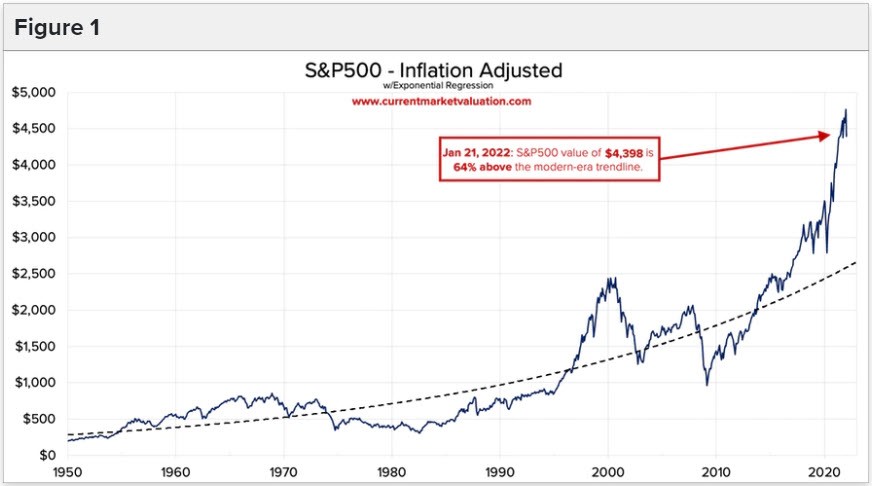
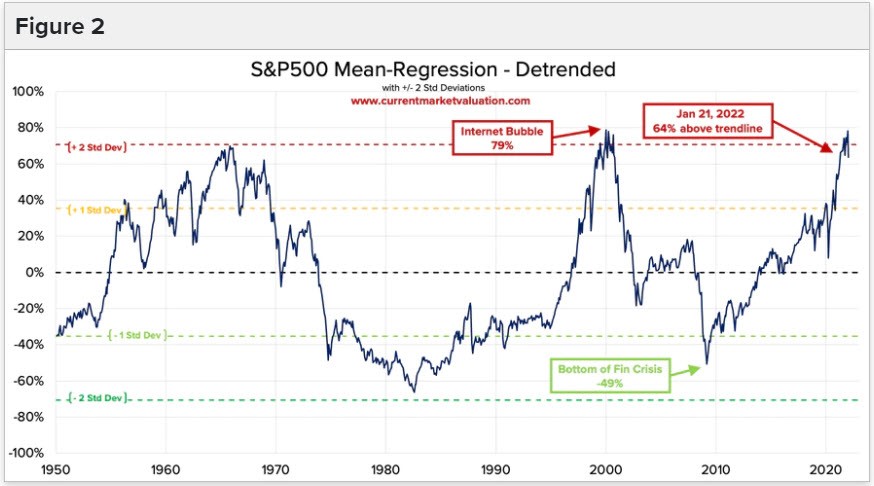
The S&P Mean Reversion Model places the S&P 500 in an “overvalued” position and in similar territory to the 2000-era-ratio peak as shown in the following charts as displayed by CurrentMarketValuation.com.
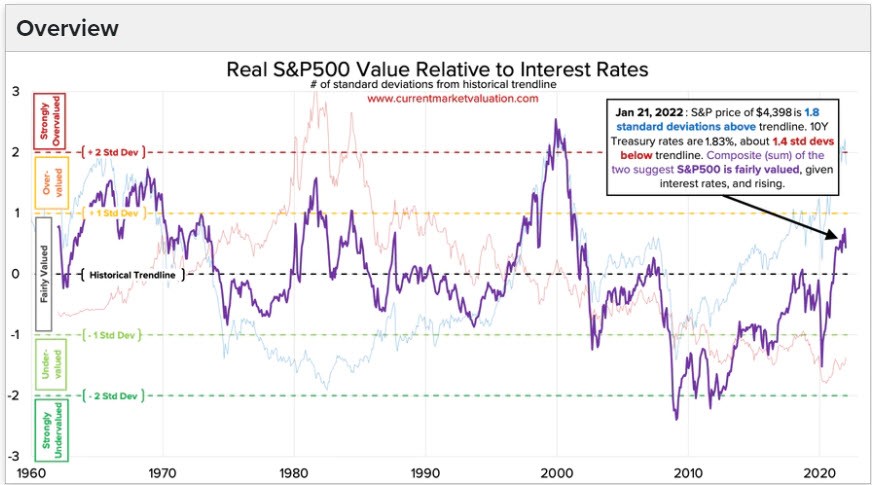
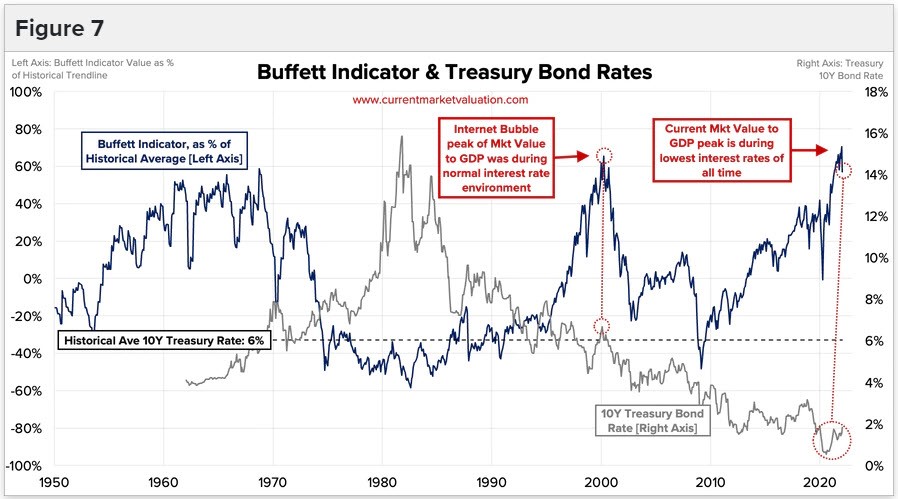
Looking at the Interest Rate Model, as analyzed and summed together, this gives a composite value of 0.7 standard deviations above normal, indicating that stocks are currently “Fairly Valued.” The average interest rate since 1960 is approximately 6% well above where we are today. If you look at equities as binary concept, either you buy them or other asset classes like fixed income, gold, real estate etcetera until the perceived risk/reward balances on a relative basis. The graph depicts two charts: 10-year treasury vs the SP 500 index. The mean for interest rates for the time-period is 6%. As you can see when rates fall below 6 percent, equities have doubled their returns from when they were above 6 percent, meaning investors are choosing to own equities rather than non-inflation adjusted fixed income asset classes. The converse exists also when rates increase equities generally become less attractive.
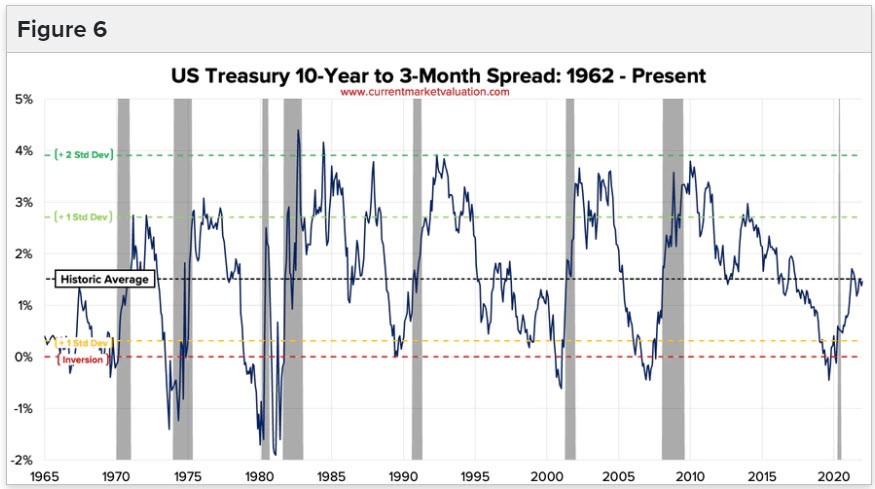
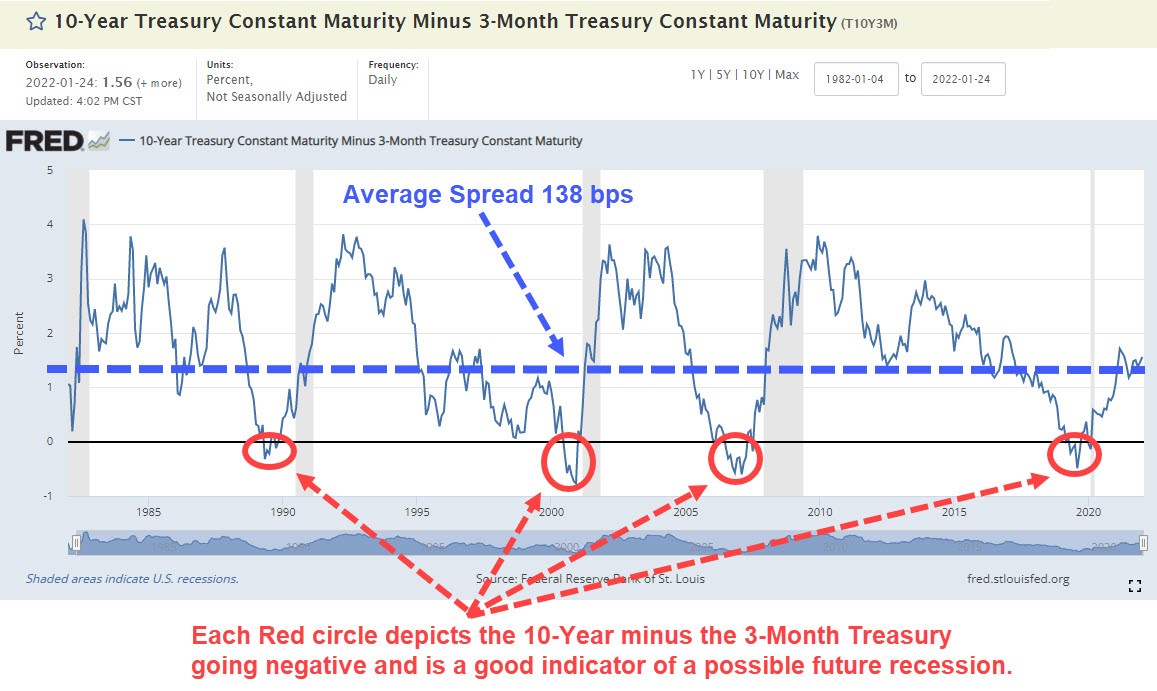
The Yield Curve Model shows that the markets may be “Fairly Valued.” It is also a historically favored model to help predict possible future economic downturns and recessions – again, showing that the ‘markets’ may predict more than a given individual success rate.

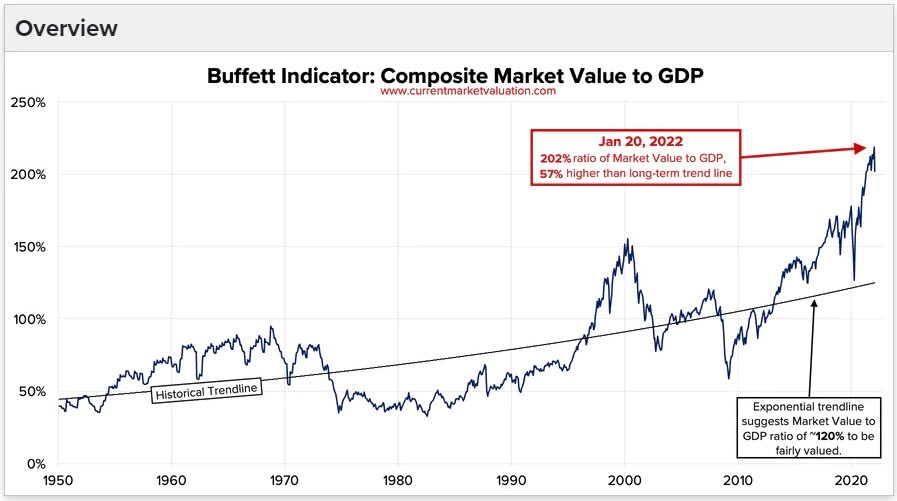
The Buffett Indicator is the ratio of total United States stock market valuation to GDP, and it also shows that the equity market is “Overvalued.”
So, who’s right? who’s wrong? Is there a canary (or group of canaries) who can help us in this coal mine that is reverting to the mean? The sailing metaphor would be having a strong keel to steady the ship. Remember the recent WSJ article that 85% of money managers could not even beet the market averages.
No matter what model (or models) you use in this example, more data points of information can help frame potential outcomes.
Top performing banks and financial institutions add understanding security portfolio costs to their Investment Committee due diligence plans and look for ways to model top performing institutions to excel during periods when reversion to the mean is the topic of conversation in the board room.
Let SB Value help you examine all these, and other methodologies, to build out your future pathways to optimizing your success.
Questions? So, ASK US HOW. Start a complementary analysis now. It’s a great time to get some additional clarity. Learn some additional truths on the front end. It may position your bank for added improvements in 2022. Listen to what a few thought leaders have to say who have written white papers on the topic at hand. Take a read through a few Fact Sheets on the subject 1. here, 2. here, and 3. here.
As fiduciaries we see quite a lot – in fact we have recently reviewed just under 13,000 data points from Community Financial Institutions – likely just like yours. We look forward to sharing with you some of what we have learned. In the meantime, we thought we would help with some general information that you and your team can consider right away to round out what you are already doing. There is a lot that’s beneficial, starting with cost savings, yield improvements, and likely better balance – even protection. To find out more please click here on our website.
Additional Source Notations: